Table of Contents
This blog post may contain affiliate links. As an Amazon Associate I earn from qualifying purchases.
You’ve squinted at that little graph on your camera screen a dozen times. It still doesn’t make sense — and you’re not alone.
“Every time I think I know how to read it, I realize I still haven’t understood how it works. I don’t know how to use it.”
That feeling is exactly why this guide exists. Without understanding the histogram, you come home with blown-out skies, crushed shadows full of digital noise (random grain that appears when shadow detail is pushed in editing), and exposures that can’t be saved — no matter how much time you spend in Lightroom. Once highlights are blown, no editing tool on earth can bring back that detail.
Understanding why use histogram photography gives you an objective, mathematical view of your exposure — one your LCD screen simply cannot provide. By the end of this guide, you’ll have a practical system for reading any histogram shape in seconds, spotting clipping before it ruins a shot, and applying pro-level techniques like ETTR to consistently nail your exposures.
Understanding why use histogram photography is the only way to see the true tonal distribution of your image — your LCD screen actively lies to you with a brightness-adjusted JPEG preview.
- The LCD Lie: Your camera screen adjusts its brightness based on ambient light, making exposures look different than they actually are — the histogram never does this.
- Clipping is permanent: Blown highlights (pure white) and crushed shadows (pure black) cannot be recovered in post-processing — the histogram shows you before it’s too late.
- ETTR advantage: Exposing to the Right — pushing exposure just before clipping — captures more shadow detail and reduces noise in RAW files.
Why Your Camera Screen Lies to You
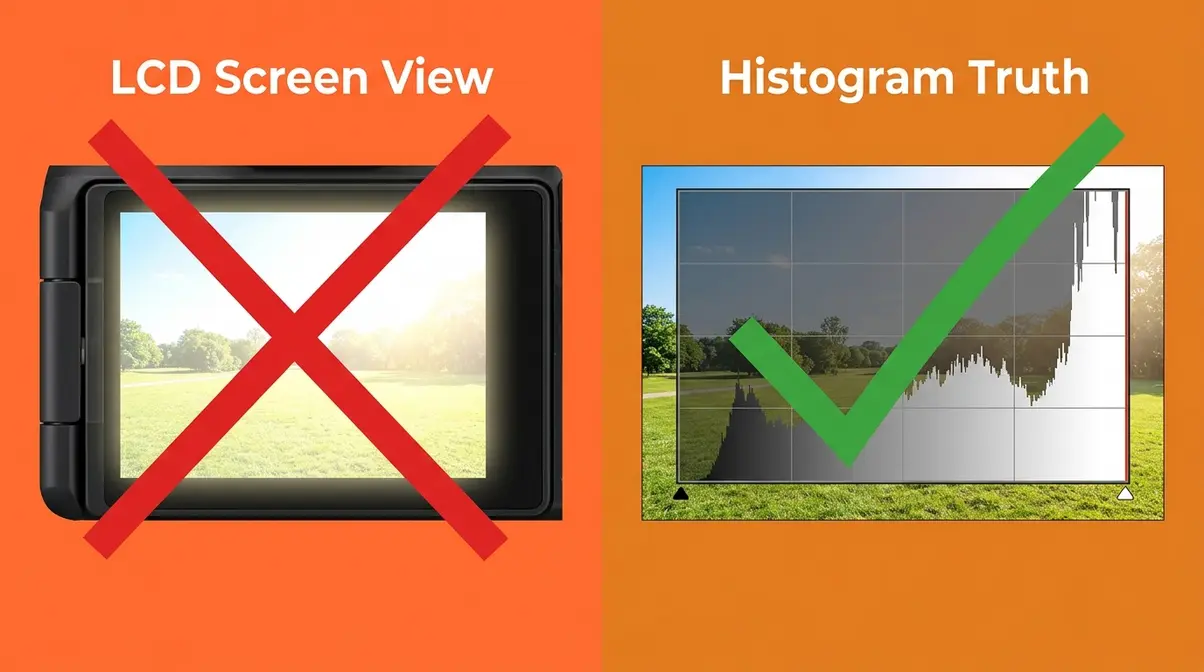
The histogram isn’t just a useful tool — it exists because your camera’s LCD screen is fundamentally unreliable for judging exposure. Understanding this is the foundation of everything else in this guide.
What Exactly Is a Histogram?
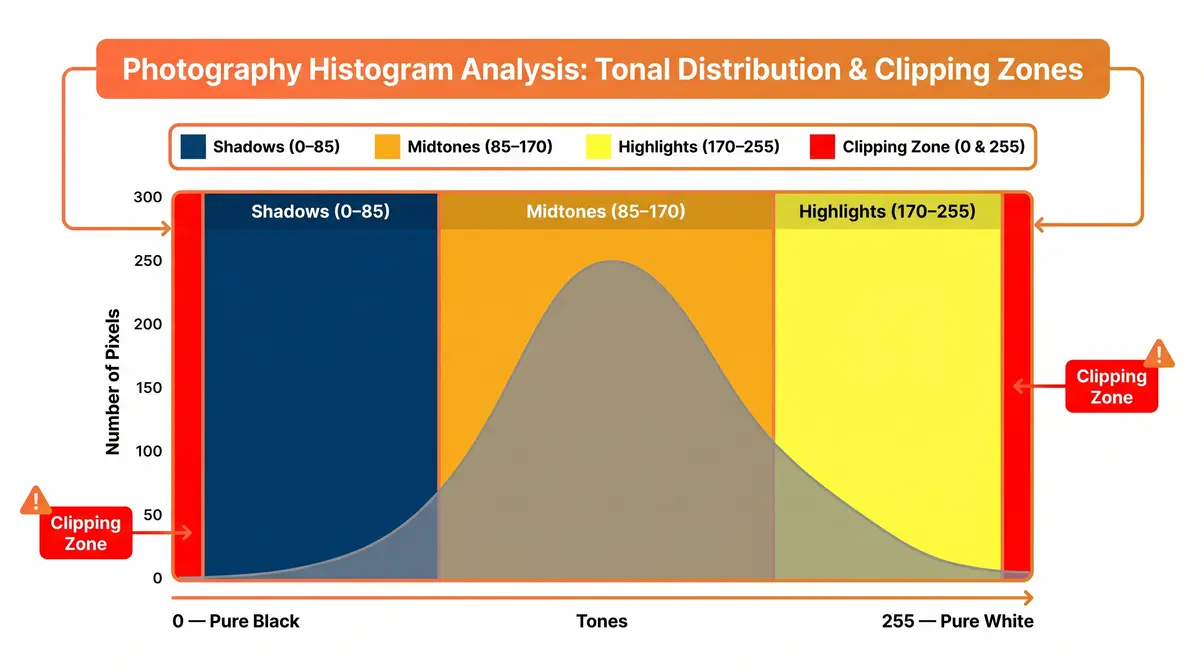
A histogram is a bar graph that shows the distribution of tones in your photograph, from pure black on the left edge to pure white on the right edge. Every pixel in your image has a brightness value between 0 (black) and 255 (white). The histogram stacks those values into columns: tall columns mean many pixels at that brightness; short columns mean few.
Think of it like a crowd at a concert. If everyone rushes to the left side of the room, you have a dark image. If everyone rushes to the right, you have a bright image. The histogram shows you exactly where the crowd is standing — no guessing required.
This matters enormously when you’re learning histogram photography because it removes subjectivity entirely, which is a critical step in understanding exposure. The graph doesn’t care how bright your camera screen is set, or whether you’re shooting in direct sunlight or a dark room. It shows you the mathematical reality of your exposure.
Why the LCD Screen Can’t Be Trusted
Here’s The LCD Lie: your camera’s rear screen is not showing you the actual exposure of your RAW file. It’s displaying a processed JPEG preview — a compressed, contrast-enhanced version of your image that the camera generates automatically. That preview is then displayed on a screen whose brightness changes based on your camera’s display settings and the ambient light around you.
Shoot in bright sunlight, and your LCD looks darker than it is — so you overexpose trying to compensate. Shoot indoors, and that same exposure looks perfectly bright. You haven’t changed anything about the photo; you’ve only changed the viewing conditions. According to B&H Photo’s exposure guide, this LCD preview inconsistency is one of the most common causes of systematic exposure errors among beginner photographers.
The histogram, by contrast, is calculated directly from the image data. It doesn’t adjust for ambient light. It doesn’t care about your screen brightness setting. It simply reports what’s there — making it the only truly objective exposure tool on your camera.
The practical consequence: Every time you chimp (check your LCD after a shot) without also checking the histogram, you’re trusting a liar.
In-Camera vs. Post-Processing
You can check your histogram in two places: on your camera immediately after taking a shot, and inside editing software like Lightroom or Photoshop. Both show the same fundamental information, but with one important difference.
Your in-camera histogram is generated from the JPEG preview — even if you’re shooting in RAW format. This means it can slightly misrepresent the actual data in your RAW file, which contains more tonal range than the JPEG preview shows. The histogram may indicate mild highlight clipping when your RAW file actually has recoverable data in those areas. DPReview’s histogram explainer notes this RAW headroom as a key reason experienced photographers expose slightly brighter than the in-camera histogram suggests is “safe.”
Your post-processing histogram in Lightroom reflects the actual developed state of your RAW file. It updates in real time as you move sliders. This makes it the most accurate tool for fine-tuning exposure during editing.
Rule of thumb: Use the in-camera histogram as your primary exposure safety check in the field. Use the post-processing histogram for precision adjustments at the desk.
How to Read a Histogram Step by Step
Learning why use histogram photography effectively starts with knowing how to read the graph. Reading a histogram is a learnable skill that takes about five minutes to understand and a few shooting sessions to internalize. Here’s your step-by-step system.
- Prerequisites / What You’ll Need:
- Estimated Time: 15 minutes
- Any digital camera with a histogram display (DSLR, mirrorless, or even a recent smartphone camera app)
- A few test shots in varying light — bright sun, shade, and indoors work well
- Optionally: Lightroom, Capture One, or any RAW editor open on your computer
Shadows, Midtones, and Highlights
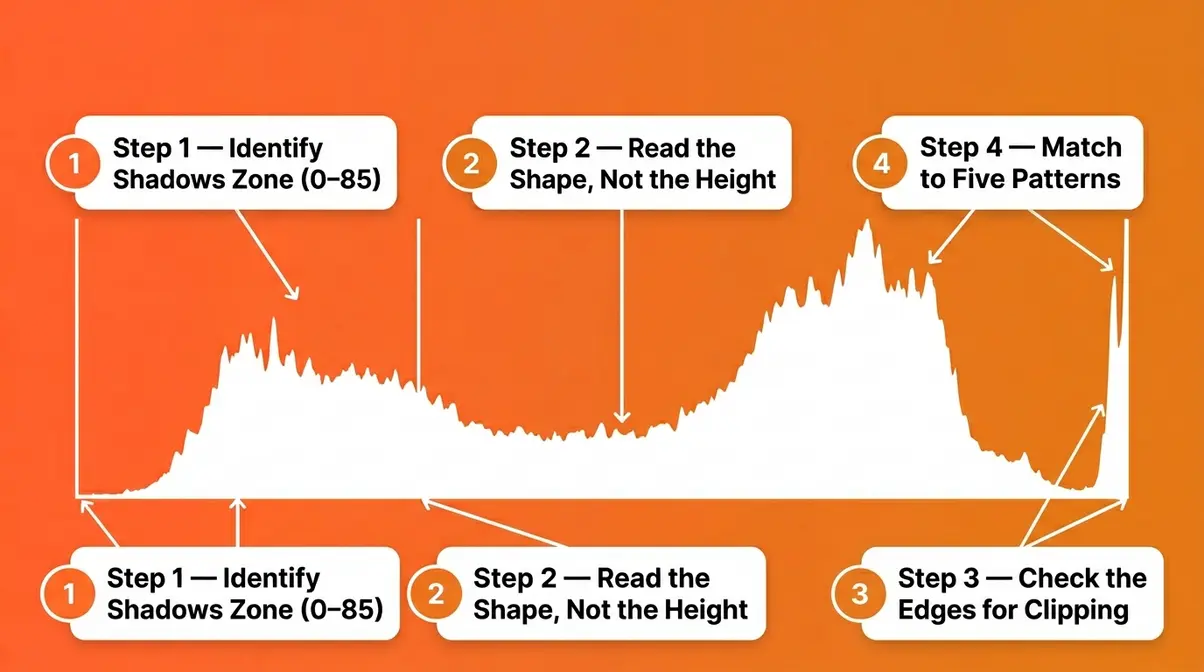
Step 1: Divide the histogram into three zones.
Look at the graph as three territories:
- Left third (0–85): Shadows — your darkest tones, including blacks
- Middle third (85–170): Midtones — skin tones, grass, mid-grey sky
- Right third (170–255): Highlights — bright areas like clouds, snow, white shirts
Step 2: Read the shape, not the height.
The height of the bars tells you how many pixels share a brightness value. A very tall bar in the midtones just means your scene is mostly medium-bright — that’s fine. What you’re watching for is data piling up against the left or right walls of the graph.
Step 3: Check the edges.
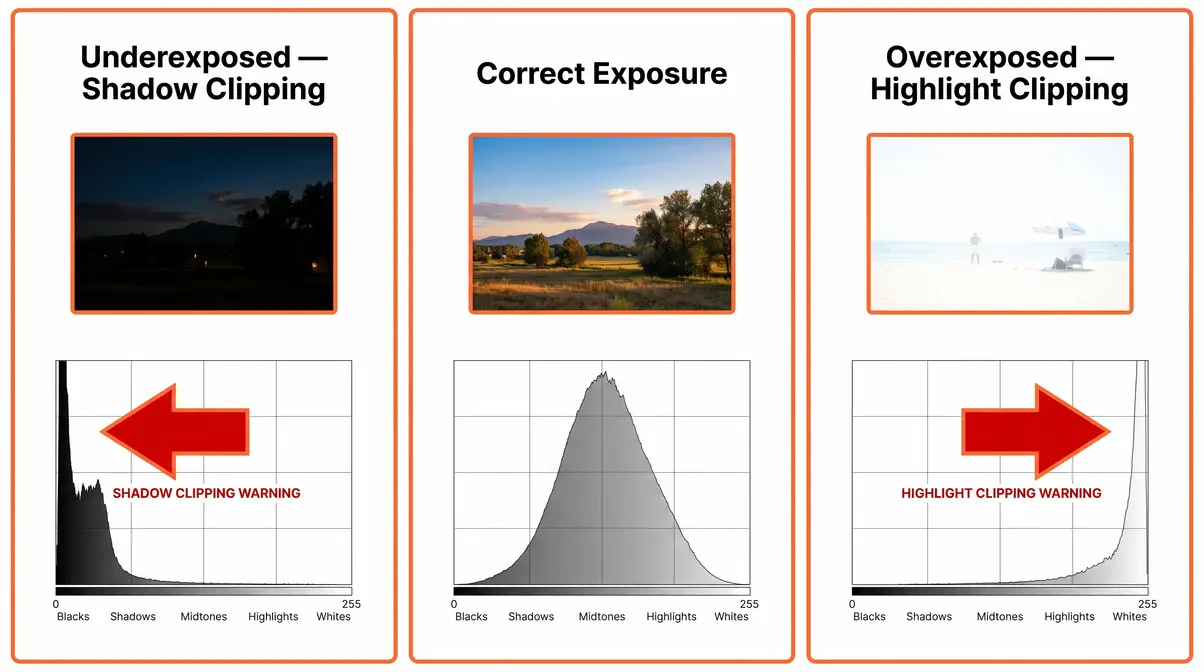
If the graph is cut off at the left edge (data “falling off” the wall), your shadows are clipping — pure black with no detail. If it’s cut off at the right edge, your highlights are clipping — pure white with no detail. Neither can be recovered in editing.
What a Good Histogram Looks Like
Here’s a truth that trips up many beginners: there is no single “correct” histogram shape. A good histogram is one that matches your creative intent without clipping important detail.
That said, for a standard outdoor scene with a full tonal range — think a person standing in soft daylight — a healthy histogram typically shows a gentle mound peaking in the midtones, with the data tapering off before it reaches either edge. No hard cutoff at the walls.
For a bright beach scene or snow shot, you’d expect the data to shift right. For a moody low-light portrait, it shifts left. Neither is “wrong.” What’s wrong is unintentional clipping — losing detail you actually wanted to keep when managing dynamic range.
User consensus across photography forums, including discussions on Photography Stack Exchange and r/photography, consistently confirms that beginners make the mistake of chasing a “perfect bell curve” histogram when the scene doesn’t warrant one.
Five Histogram Shapes Explained
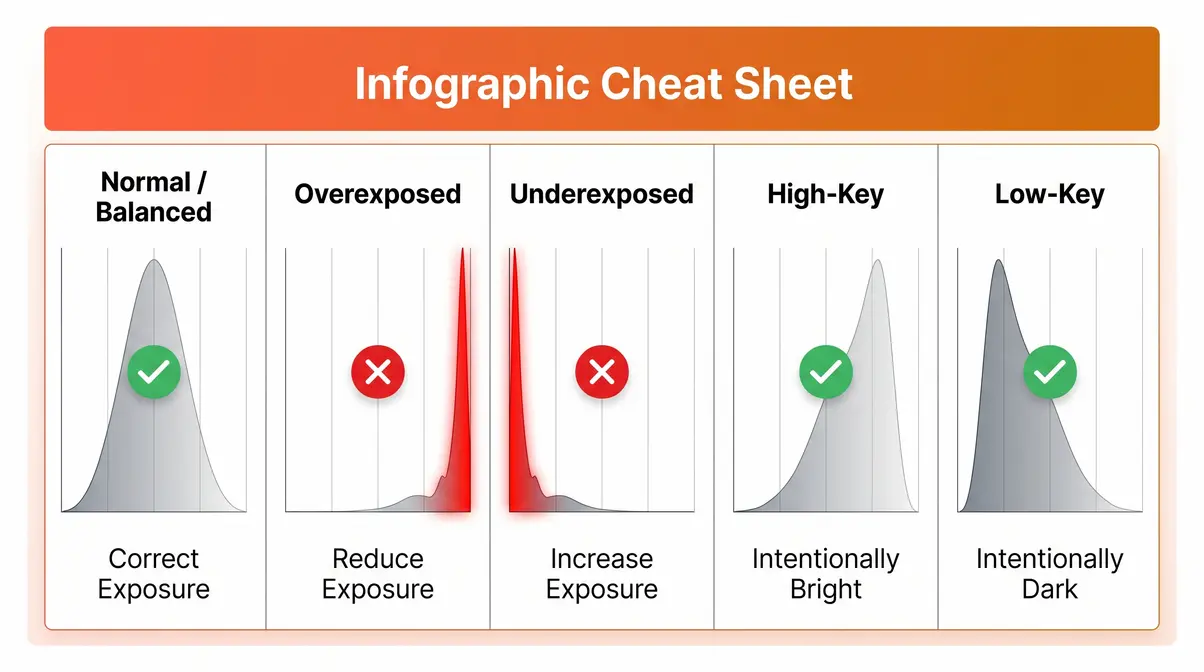
Step 4: Match the shape to these five patterns.
| Shape | What It Looks Like | What It Means |
|---|---|---|
| Normal/Balanced | Gentle mound, centered, no wall clipping | Full tonal range, correct exposure for most scenes |
| Overexposed | Data bunched right, clipping at right wall | Highlights blown — reduce exposure |
| Underexposed | Data bunched left, clipping at left wall | Shadows crushed — increase exposure |
| High-Key | Data shifted right, but NO clipping | Intentionally bright scene (snow, white background portrait) — this is correct |
| Low-Key | Data shifted left, but NO clipping | Intentionally dark, moody scene (night, silhouette) — this is correct |
Real-World Practice: Tricky Lighting
This is where theory meets reality. Here are eight common tricky-lighting scenarios and what the histogram tells you in each one:
Scenario 1 — Snow scene: The scene is legitimately bright. Your histogram should sit to the right. If you try to center it, you’ll underexpose the snow, making it look grey. Accept the right-shifted histogram; just confirm no right-wall clipping on the snow itself.
Scenario 2 — Night sky / astrophotography: Most of the frame is very dark. Expect heavy data on the left. The stars create tiny spikes on the right. This is correct — don’t panic and overexpose trying to “fix” it.
Scenario 3 — High-key portrait (white backdrop): Background and clothing push data right. As long as skin tones aren’t clipping, the right-heavy histogram is intentional and correct.
Scenario 4 — Low-key dramatic portrait: Moody lighting with deep shadows. Data sits left. This is the creative goal — a centered histogram would flatten the drama entirely.
Scenario 5 — Silhouette at sunset: Your subject is pure black (intentional left-wall clipping on the subject), while the sky sits in midtones-to-highlights. The histogram will show a two-humped shape. This is correct for the creative intent.
Scenario 6 — Bright sunset with foreground: A classic high-contrast challenge. The sky and foreground can’t both be correctly exposed without HDR or graduated ND filters. The histogram shows a wide spread with potential clipping at both ends — this tells you the dynamic range (the total span from darkest to brightest) exceeds what your sensor can capture in one shot.
Scenario 7 — Indoor window light: The window blows out easily while the interior goes dark. Watch the right wall carefully. Expose for the interior and accept a blown window, or expose for the window and use flash/reflector to lift the shadows.
Scenario 8 — Overcast flat light: Data clusters in the midtones with very little shadow or highlight information. The histogram looks narrow and centered. This is accurate — the scene genuinely lacks contrast. Canon’s histogram guide describes this as a “compressed” histogram and recommends adding contrast in post if needed.
How to Use the Histogram to Prevent Clipping
Clipping is the exposure problem the histogram was specifically designed to catch. Understanding it thoroughly protects your images before they’re ruined.
What Is Clipping?
Clipping occurs when pixel values hit the absolute limits of the brightness scale — either 0 (pure black) or 255 (pure white). At those values, all tonal information is gone. A clipped highlight isn’t a very bright white — it’s a mathematically empty white with no detail whatsoever. A clipped shadow isn’t a very dark black — it’s an empty void.
The critical point: clipped pixels cannot be recovered in editing. You can’t “bring back” detail that was never recorded. This is fundamentally different from pixels that are merely bright or dark — those can often be adjusted significantly in a RAW editor. According to Digital Photography School’s histogram tutorial, highlight clipping is the single most common preventable error in beginner photography.
Most cameras offer a “highlight alert” (sometimes called “blinkies”) — a flashing warning that appears over clipped areas in the LCD preview. Enable this in your camera’s playback settings. It works alongside the histogram to show you exactly where in the frame clipping is occurring, not just that it’s occurring.
Spotting Blown Highlights
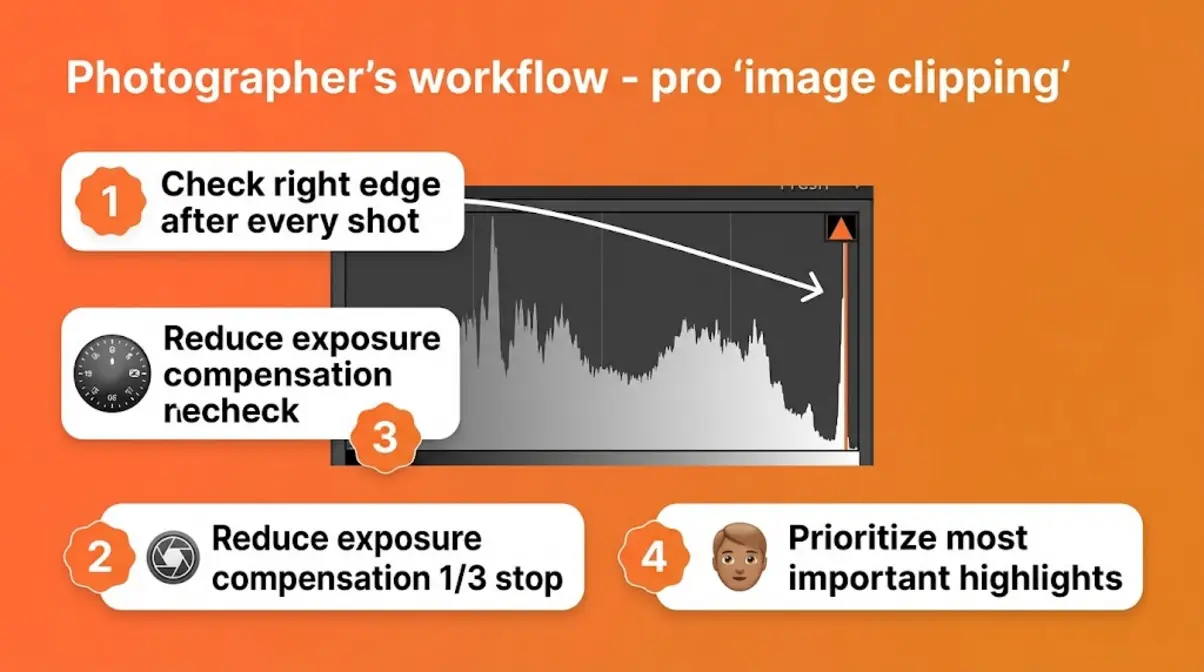
Blown highlights appear as a spike or cliff at the right edge of the histogram — the data literally hits the wall and has nowhere to go. On your camera’s playback screen with highlight alert enabled, these areas flash as solid white or red.
To fix blown highlights in the field:
- Check the right edge of your histogram immediately after each shot
- Reduce exposure compensation (usually the +/- button) by 1/3 to 2/3 of a stop
- Reshoot and recheck — repeat until the right edge shows data tapering off rather than cutting off
- Prioritize the most important highlights — a slightly blown sky matters less than blown skin tones or product labels
The most common blown-highlight trap for beginners is shooting portraits in harsh sunlight. The forehead and cheekbones catch direct light and clip easily. Move your subject to open shade, or reduce exposure until the highlight alert clears from their face, which is essential for avoiding overexposure and blown highlights.
Spotting Crushed Shadows
Crushed shadows appear as a spike at the left edge of the histogram. Dark areas have clipped to pure black — and just like blown highlights, that detail is gone. Trying to brighten crushed shadows in Lightroom reveals only digital noise: random grain and color speckles that look worse than the original dark area.
The practical challenge is that shadow clipping is easier to tolerate than highlight clipping. Human vision is more forgiving of deep blacks than featureless whites, and some scenes genuinely call for pure black areas (silhouettes, dark backgrounds). The question is always: is this clipping intentional, or did I not notice it?
To check for shadow clipping:
- Examine the left edge of your histogram
- Ask: Is there anything in the shadows I want to keep? (A face? Texture in clothing? Background detail?)
- If yes: Increase exposure until the left-wall spike reduces, then verify highlights haven’t clipped
- If no: The shadow clipping is intentional — leave it
Clipping in Action: Four Scenarios
Scenario A — Beach portrait in midday sun: Both the sand and sky push toward clipping. The histogram shows data bunched at both edges. Solution: Use exposure compensation to protect skin tones (the most important element), accept some sky clipping, and use a reflector or fill flash to lift the shadows.
Scenario B — Concert/stage photography: Deep shadows in the crowd, bright spotlights on the performer. Left-wall clipping is unavoidable and acceptable. Right-wall clipping on the performer’s face is not — reduce exposure until the face detail is protected, even if the lights themselves clip.
Scenario C — Product photography on white background: You need the background pure white, but not the product itself. This is intentional right-wall clipping on the background. Expose until the product’s histogram data is clean, then let the background clip deliberately.
Scenario D — Golden hour landscape: The sky is 3-5 stops brighter than the foreground. The histogram spans the full width with potential clipping at both ends. This is the sensor’s dynamic range limit — no single exposure can capture both. The histogram tells you this is a situation for using exposure bracketing or a graduated filter, not an exposure error.
Advanced Techniques for Better Image Quality
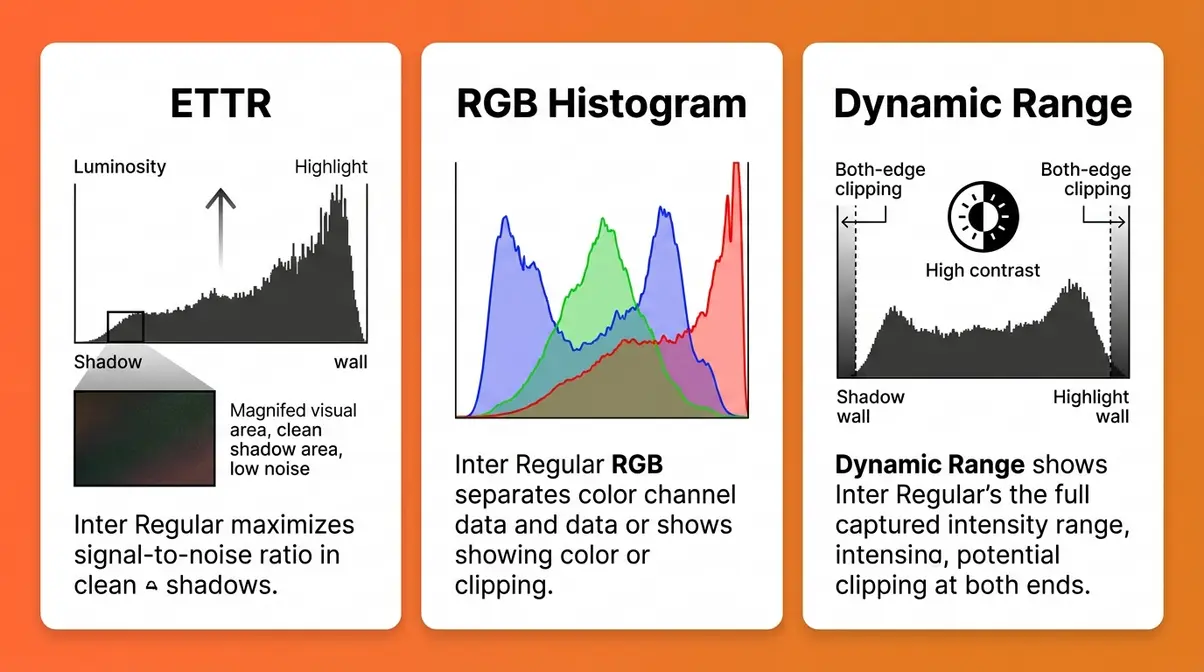
Once you’re comfortable catching clipping, you will quickly see why use histogram photography for advanced applications. These three techniques take your exposures to a professional level.
Exposing to the Right (ETTR)
ETTR (Exposing to the Right) is the practice of intentionally pushing your exposure as bright as possible without clipping the important highlights. The name comes from the histogram — you’re moving the data as far right as it can go while keeping it off the right wall.
Why does this improve image quality? Digital camera sensors are more efficient at capturing tonal information in bright areas than in dark ones. When you expose brighter, you’re recording more actual light data — which means more detail and less digital noise (random grain) when you process the file. According to Photography Pro’s ETTR breakdown, properly applied ETTR can reduce visible shadow noise by the equivalent of 1-2 stops of ISO improvement.
How to apply ETTR:
- Take a test shot at your metered exposure
- Check the histogram — note the right edge
- Increase exposure compensation in 1/3-stop increments
- Recheck the histogram after each increment
- Stop when the highlights approach (but don’t touch) the right wall
- In editing, pull the Exposure slider left to restore natural brightness — the shadow detail will be visibly cleaner than a darker original capture
Important caveat: ETTR only works well when shooting in RAW format. JPEG files have no headroom — what you see is what you get. Shooting JPEG and exposing right simply gives you an overexposed JPEG.
Common mistake: Beginners sometimes confuse ETTR with overexposure. They’re not the same. ETTR is a deliberate, controlled push to the edge of clipping. Overexposure crosses that edge and destroys data. The histogram is what keeps you on the right side of that line.
Understanding the RGB Histogram
Most cameras default to showing a luminance histogram — a single grey graph representing the overall brightness of each pixel. This is useful, but it has a blind spot: it can miss color-specific clipping.
An RGB histogram displays three overlapping histograms — one each for the Red, Green, and Blue color channels. Each channel clips independently. A sunset photo, for example, might show a perfectly clean luminance histogram while the Red channel is fully clipped — meaning you’ve lost all red detail in the clouds, even though the overall brightness looks fine.
- To enable the RGB histogram on most cameras:
- Canon: Playback → Info display → Histogram display → RGB
- Nikon: Playback Menu → Histogram display → RGB
- Sony: Playback → DISP button → cycle to histogram view, then select RGB
When the RGB histogram matters most:
| Situation | Channel to Watch |
|---|---|
| Sunsets / sunrise | Red channel |
| Blue sky / ocean | Blue channel |
| Green foliage in harsh light | Green channel |
| Highly saturated subjects (red flowers, yellow objects) | Whichever channel matches the dominant color |
Histograms and High Dynamic Range
Dynamic range is the total span from the darkest shadow to the brightest highlight that a camera sensor can capture in a single exposure. Modern full-frame mirrorless cameras typically offer 13-15 stops of dynamic range (Sony, Canon, and Nikon all publish these specifications in their sensor data sheets). A typical outdoor scene on a sunny day can span 10-14 stops — right at or beyond what a single exposure can handle.
The histogram shows you when a scene’s dynamic range exceeds your sensor’s capacity: when the data spans the full width from wall to wall with clipping at both ends, you’re looking at a dynamic range problem, not an exposure error.
- Your options in this situation:
- Expose for the most important element and accept clipping elsewhere
- Bracket exposures (take multiple shots at different exposures, merge in post, ideal when exploring HDR photography)
- Use a graduated ND filter to darken the bright sky and bring it within range
- Wait for better light — golden hour and overcast conditions compress dynamic range significantly
Community feedback across photography forums on platforms like Photography Life consistently confirms that understanding what the histogram reveals about dynamic range limits is one of the most valuable “aha moments” for intermediate photographers who previously blamed their gear for high-contrast failures.
When the Histogram Can Mislead You
The histogram is an objective tool — but it can only tell you what’s there, not whether it’s appropriate for your creative intent. Understanding its limits makes you a more confident, flexible photographer.
When a “Bad” Histogram Is Correct
A histogram with heavy data on the left isn’t broken — it might be exactly right. A silhouette against a bright sky, a candlelit portrait, a black-background product shot: all of these produce “bad-looking” histograms that are creatively perfect.
The same applies in the other direction. Snow photography, high-key fashion portraits, and backlit translucent subjects all legitimately push data to the right. Trying to correct a high-key histogram to a centered bell curve would ruin the shot.
The rule: A histogram is only “wrong” if it doesn’t match your intent. Before judging the graph, ask yourself: What am I trying to achieve with this image? If the histogram matches that intention — even if it looks unusual — it’s correct.
This is why experienced photographers always describe the histogram as a diagnostic tool, not a prescription, especially when understanding camera metering modes. It tells you what’s happening; you decide if that’s what you wanted.
When Should You Not Use a Histogram?
There are situations where checking the histogram is impractical or counterproductive:
- Fast-moving subjects: Sports, wildlife, street photography — by the time you’ve chimped, the moment is gone. Set your exposure before the action starts and trust it.
- Continuous shooting bursts: You’re capturing 10+ frames per second. Histogram-checking between bursts is the workflow here, not between individual frames.
- Low-light events: Concerts, weddings in dark venues — ambient light changes constantly. Set a conservative exposure that protects the most important highlights, then adjust between song breaks or scenes.
In these situations, rely on your pre-set exposure and your knowledge of the scene’s dynamic range, which is a key part of mastering the role of light. Return to histogram-checking when the pace allows.
The JPEG Preview Problem
This is the deepest version of The LCD Lie — and it affects every RAW shooter who uses their in-camera histogram without knowing this.
Your in-camera histogram is built from the JPEG preview file, not from the actual RAW data. Camera manufacturers apply a “picture profile” (contrast, saturation, sharpening settings) to generate that preview, and this profile affects the histogram. If you’re shooting with a high-contrast picture profile, the histogram will show more clipping than your RAW file actually contains — because the JPEG processing is clipping that data even though the RAW sensor data is still intact.
This means your RAW file has RAW headroom — extra recoverable highlight and shadow information that exists in the sensor data but doesn’t appear in the in-camera histogram. Experienced photographers account for this by exposing slightly brighter than the in-camera histogram suggests is “safe,” knowing the RAW file can handle it.
One advanced technique related to this is UniWB (Uniform White Balance) — a custom white balance setting that makes the in-camera JPEG preview more accurately reflect the actual RAW data distribution. It produces a greenish, ugly preview image, but the histogram becomes far more accurate for RAW shooters. Most photographers won’t need this, but it illustrates exactly how significant the JPEG preview problem can be.
The practical takeaway: If you’re shooting RAW and your in-camera histogram shows mild highlight clipping, don’t panic. Import the file into Lightroom and check the actual RAW histogram — there’s a good chance the data is still there. The in-camera histogram is a guide, not a guarantee.
Frequently Asked Questions
Main Advantage of Histograms?
The main advantage of using a histogram in photography is that it gives you an objective, numerical view of your exposure that your LCD screen cannot provide. Your camera screen changes appearance based on ambient light and screen brightness settings — the histogram never does. It shows the precise distribution of tones from pure black to pure white, allowing you to catch clipping before it destroys detail you can’t recover. Most photographers who adopt consistent histogram use report fewer unrecoverable exposures within their first few shooting sessions.
Main Purpose of a Histogram?
The main purpose of a histogram is to show you whether your image contains any clipped pixels — areas of pure black or pure white with no recoverable detail. Beyond clipping detection, it shows the overall tonal balance of your image: whether it skews dark, light, or sits in the midtones. This lets you make informed, objective exposure decisions rather than relying on the unreliable LCD preview. Think of it as the difference between guessing a temperature by feel versus reading a thermometer.
Histogram vs. LCD Screen?
Someone uses a histogram instead of the LCD because the LCD screen actively misleads you — it displays a brightness-adjusted JPEG preview that changes appearance based on ambient light and your screen’s backlight setting. In direct sunlight, your LCD looks darker and you overexpose compensating. Indoors, it looks brighter than reality. The histogram is calculated mathematically from your image data and is completely unaffected by viewing conditions. It’s the difference between a subjective impression and an objective measurement.
Disadvantages of Histograms?
The main disadvantages of the histogram are that the in-camera version is built from the JPEG preview rather than the actual RAW data, which can show false clipping that doesn’t exist in your RAW file. It also tells you that clipping is happening but not where in the frame — you need the highlight alert (blinkies) for spatial information. Additionally, the histogram requires you to stop and check, which isn’t always practical during fast-paced shooting. Finally, a histogram can’t tell you whether an unusual tonal distribution is a creative choice or an error — that judgment is always yours.
Does ETTR Work for JPEG Files?
Exposing to the Right (ETTR) does not work effectively for JPEG files. JPEGs are compressed image files with no extra headroom, meaning what you see on the screen is exactly what is recorded. If you push the exposure to the right and clip any highlights in a JPEG, that data is permanently lost and cannot be recovered. ETTR is a technique specifically designed to maximize the data captured in RAW files, which contain significantly more tonal information than JPEGs.
Putting It All Together
The histogram is one of those tools that feels overwhelming right up until the moment it clicks — and then you can’t imagine shooting without it.
Every concept in this guide connects back to The LCD Lie: your camera screen is showing you a processed approximation, while the histogram is showing you the mathematical truth. If you have ever wondered why use histogram photography, the answer is simple: it gives you the mathematical truth. Once you accept that your screen can’t be trusted for precise exposure judgment, the histogram stops feeling like an extra step and starts feeling like the essential check it is. Community feedback across photography forums consistently shows that photographers who make histogram-checking habitual within their first year of shooting report far fewer frustrating editing sessions dealing with unrecoverable exposures.
Start with one habit: after every shot in tricky light, press the playback button and switch to histogram view. Look for wall-to-wall data or clipping at the edges. That single habit — applied consistently — will improve your keeper rate more than any new piece of gear.
The next step is to take these concepts into the field this week. Pick one of the eight real-world scenarios above — snow, sunset, or a simple portrait in window light — and practice reading the histogram for that scene specifically. Once that scenario feels intuitive, move to the next. Within a few weeks, you’ll be reading any histogram shape in seconds, catching clipping before it costs you a shot, and applying ETTR to squeeze every bit of quality from your RAW files.